Donor Management System
Want to learn more about this feature?
Track your Summarized Report data straight from your main Dashboard by adding a customized Chart as a Dashlet.
By default, these Custom Dashlets will only be seen by the DMS User who generated them but any User can configure it on their Dashboard.
Considerations
Before you can add is as a Dashlet on our Dashboard, you'll first need to generate a Bar Chart or Pie Chart from within the Reports Tab.
Adding a Chart as a Dashlet
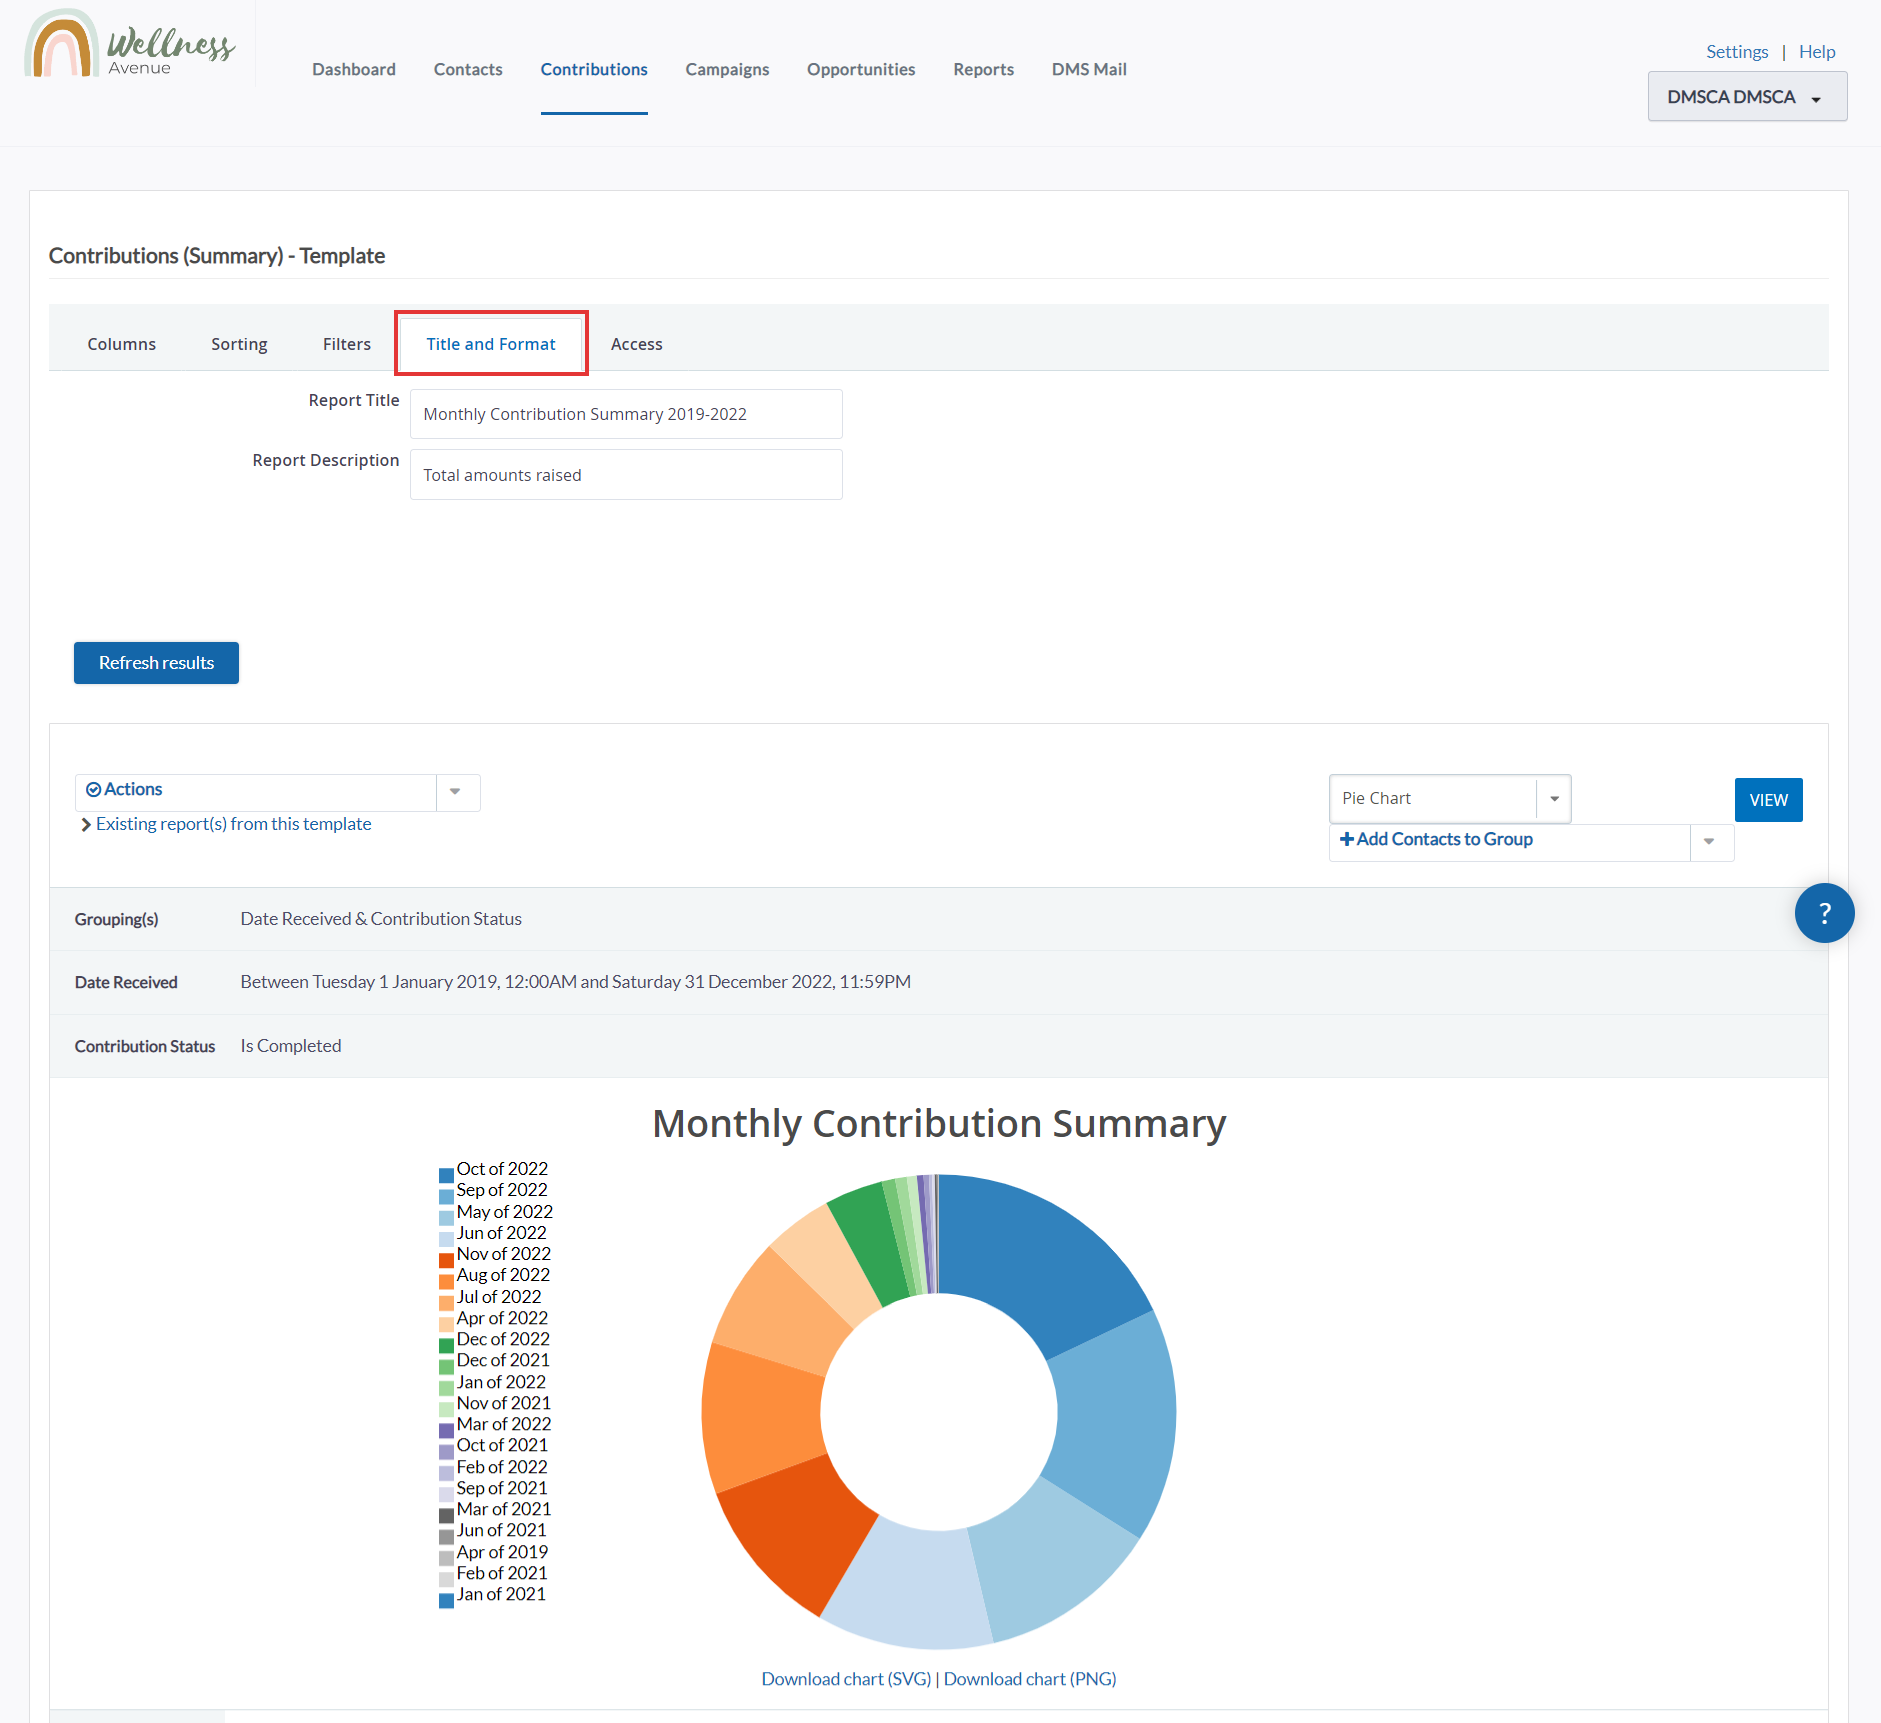
1. Once your Chart has been generated, give it a Title and Description.
Note: this title will be displayed on your Home Dashlet.
2. Next, on the Access subtab, check off Available for Dashboard? to add the Report to your Dashboard. Then, under Actions, select Save
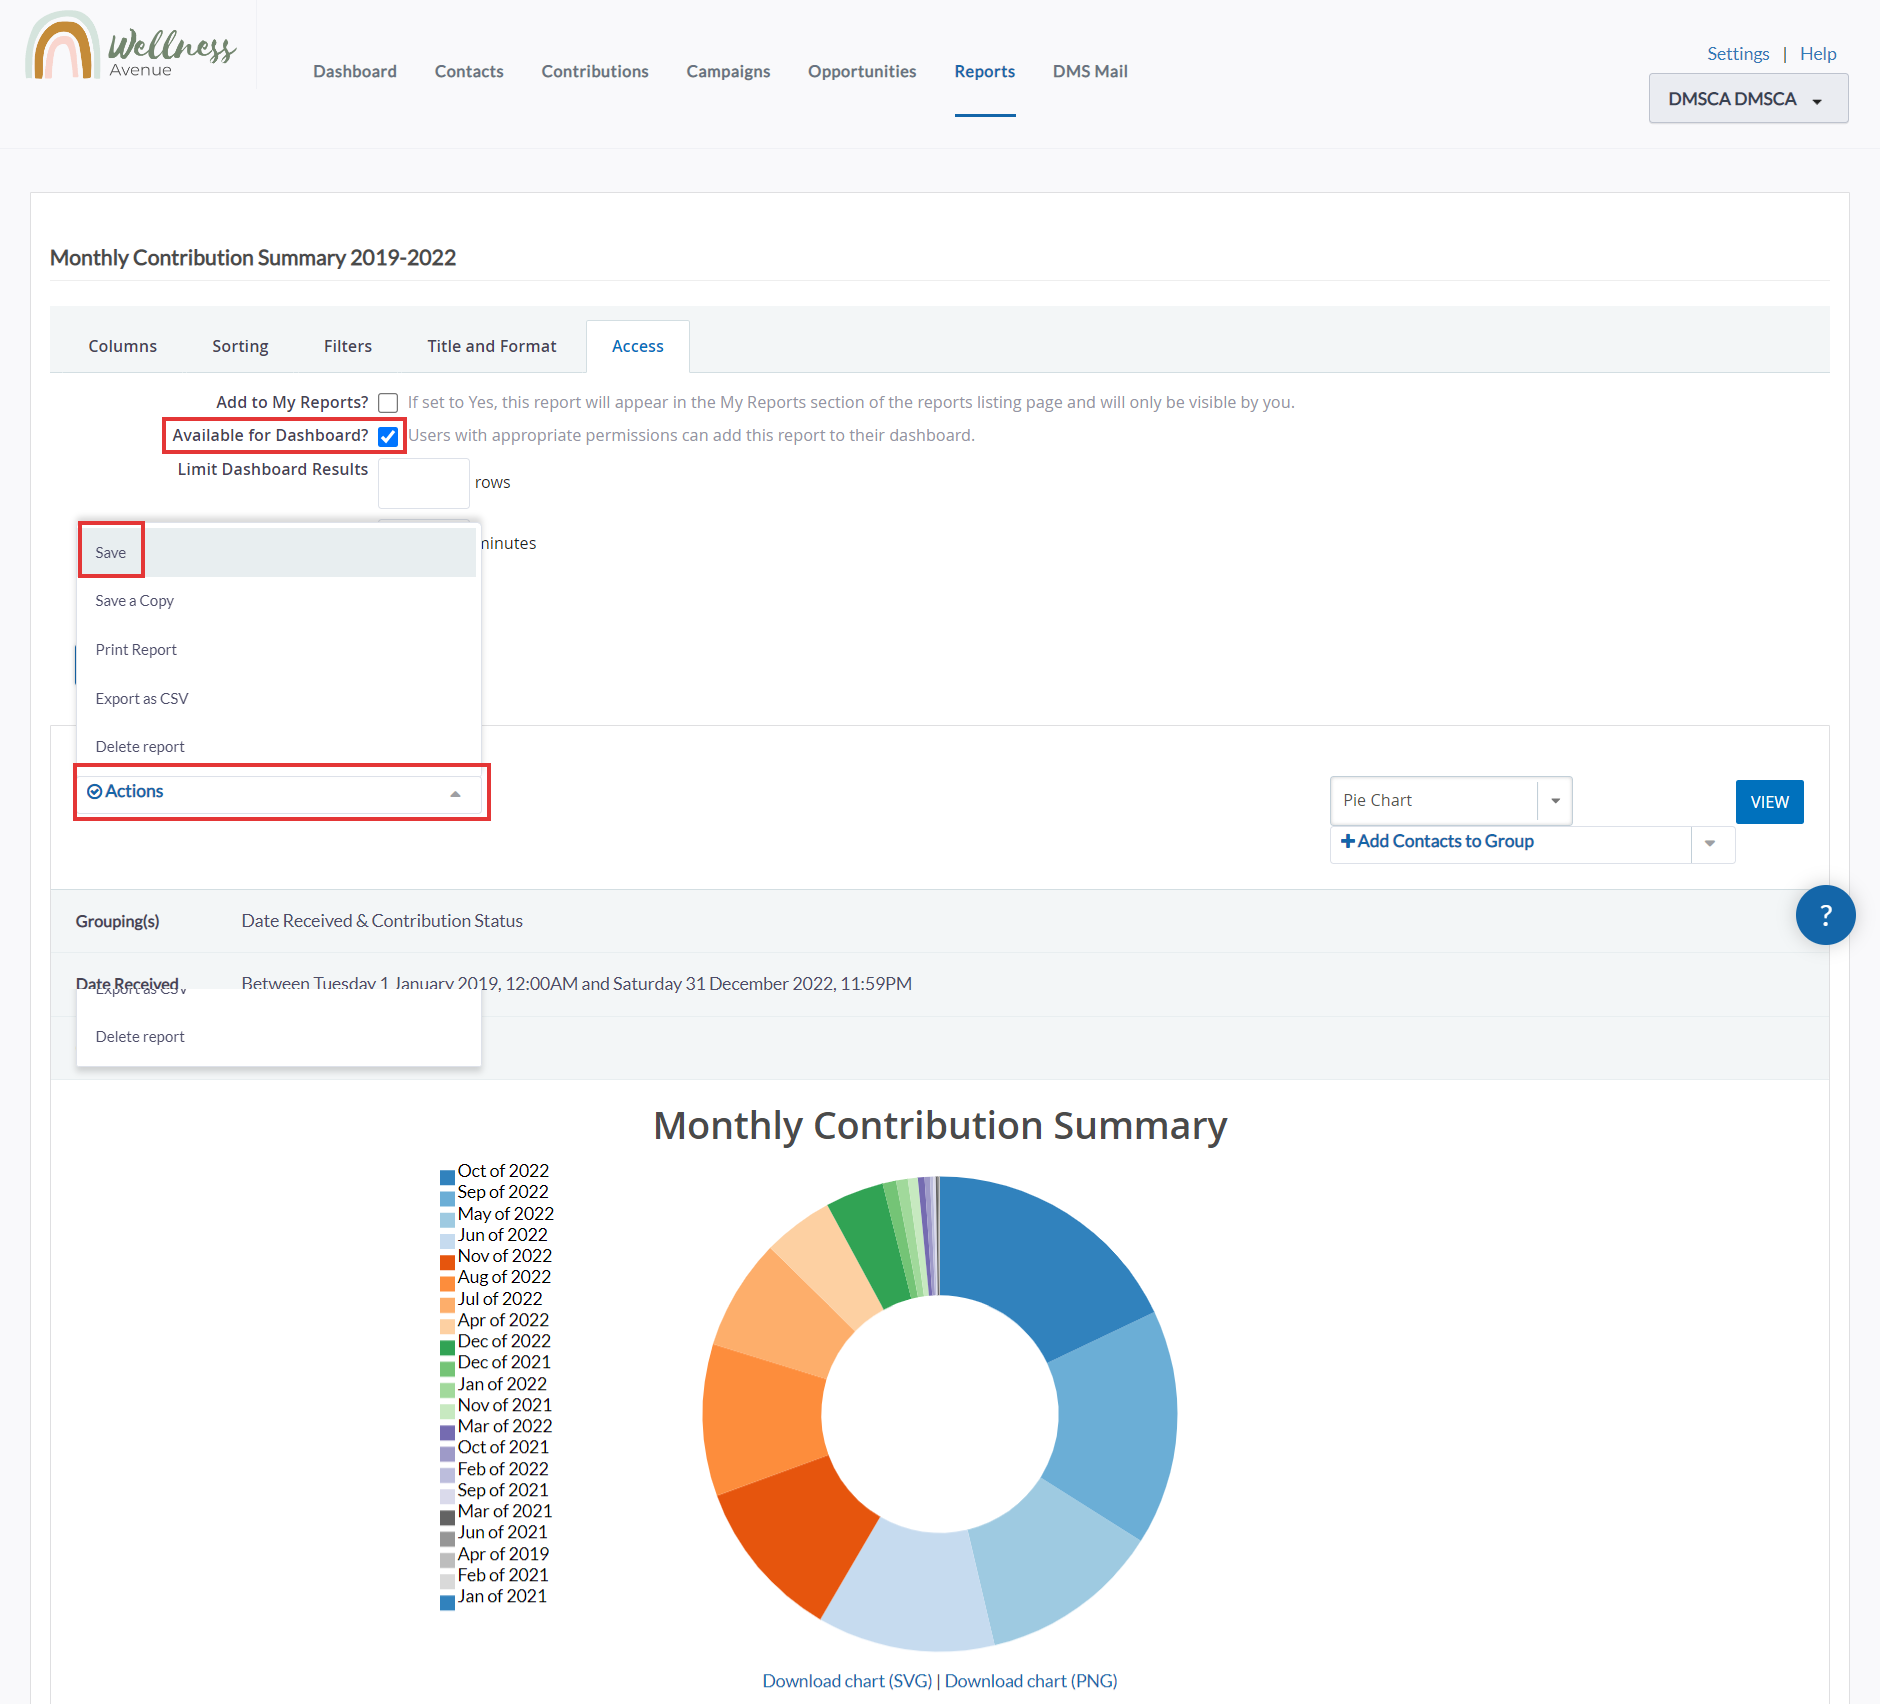 Make Available for Dashboard and Save
3. Now, if you visit your Dashboard, you will see your new Dashlet on the screen.
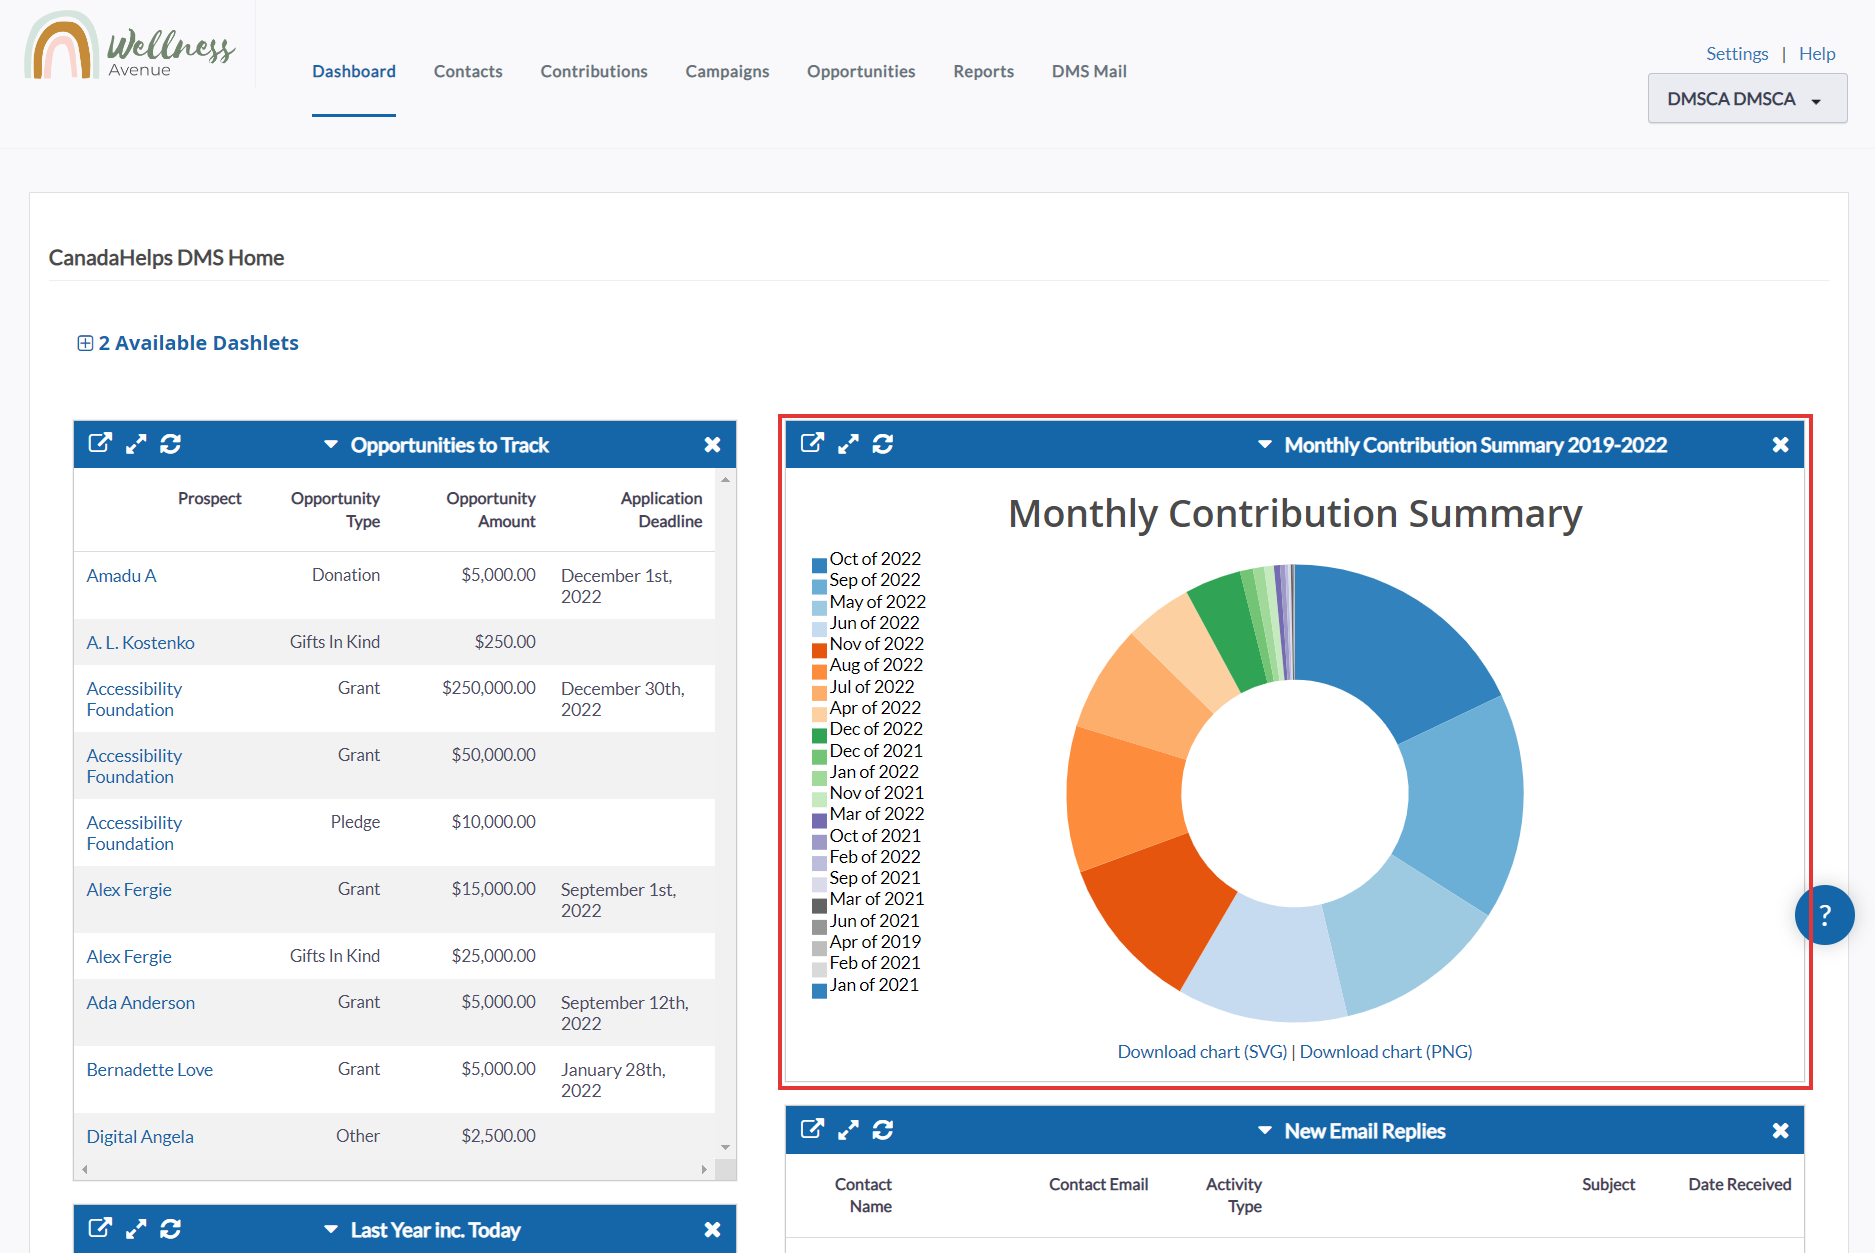 Previously-configured Dashlet
4. If needed, drag and Drop your new Dashlet where ever you'd like to position it on your Dashboard.
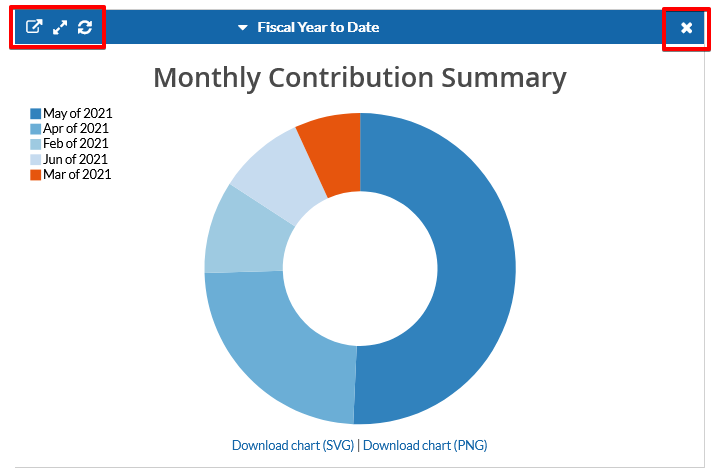
5. Once your Dashlet is in place, you can:
- View Report: will take you to the original Report in a New Tab
- View Fullscreen: will open a fullscreen view of the chart within your Home Tab
- Refresh: the Dashlet will refresh regularly, however, you can refresh it manually
- Remove from Dashboard: will place your Chart back under your Available Dashlets.
 Overview Pie Chart